


Evaluation of quality of biscuits prepared from wheat flour and cassava flour
Muhammad Mahbub Sobhan1, Raju Ahmmed1![]()
![]() , Md. Nazmul Islam Mazumder2, Md. Abdul Alim1
, Md. Nazmul Islam Mazumder2, Md. Abdul Alim1
1Department of Food Technology and Rural Industries, Bangladesh Agricultural University, Mymensingh-2202, Bangladesh
2Bangladesh Institute of Nuclear Agriculture, Mymensingh-2202, Bangladesh
| ABSTRACT | Get Full Text PDF |
This study reports on processing of biscuits using skinned, treated and dried cassava flour. Five samples of biscuits S2, S3, S4, S5 and S6 containing 8, 16, 24, 32 and 40% cassava flour with wheat flour and a control sample (S1) containing no cassava flour were processed. The weights of all the biscuit samples were higher than that of control biscuit. The biscuit containing cassava flour was lower width than the control biscuit. The spread ratio of biscuits with 16% cassava flour was higher than other combinations of cassava flour. No remarkable changes in moisture content, peroxide value, fatty acid value, texture and flavor were observed up to 4 months of storage in ambient conditions (27° to 35°C). A decreasing trend in color, flavor, texture and overall acceptability was observed with the increased incorporation of cassava flour. The sample S1 (no cassava flour) secured the highest overall acceptability and sample S6 (40% cassava flour) obtained the lowest overall acceptability. It is recommended that good quality cassava flour fortified biscuits may be processed in industrial scale substituting the wheat flour by cassava flour up to 24% levels.
Keywords: Cassava flour, wheat flour, shelf life, spread ratio, storage, biscuit
*Corresponding author. Tel.: +88 01722979157
E-mail address: rahmmed.bau@gmail.com (R Ahmmed)
Copyright@2014 Int. J. Nat. Soc. Sci. all right reserved.
How to cite this article: Sobhan MM, Ahmmed R, Mazumder MNI and Alim MA (2014). Evaluation of quality of
biscuits prepared from wheat flour and cassava flour. International Journal of Natural and Social Sciences, 1(2): 12-20.
INTRODUCTION
Food deficit is increasing day by day. So it is a burning question to meet the food requirement of millions of people living in poverty in the third world. Attempts to resolve the problems of food production have placed great emphasis on increasing the production and productivity of grain crops, but little attention has been given to crops such as cassava (Manihotesculenta crantz). Cassava roots are important dietary staple for possibly as many as 500 million people in the tropical countries of the world (Matthews and Hunt, 2010). Cassava is the seventh among the important crops of the world and is of prime importance in many countries either as a chief staple or as an important supplementary food. Cassava is a starchy root crop that is grown entirely within tropics. In 2011, world production of cassava was about 256 million tons (FAO, 2011). Nigeria is the largest producer of cassava. In Bangladesh, cassava is a minor tuber crop in comparison with potato and sweet potato and is grown and consumed in Bangladesh mainly by the tribal people of Madhupur, Garo Hill and Chittagong Hill tracks. In Bangladesh the estimated annual production of cassava is about 30,000 tons (Shams-Ud-Din, 2002). Besides, a great source of energy, attention fell upon cassava for its industrial uses such as for production of starch, glucose, alcohol etc. According to (Tonukari, 2004), cassava ranks very high among crops that convert the greatest amount of solar energy into soluble carbohydrates per unit of area. Among the starchy staples, cassava gives a carbohydrate production which is about 40% higher than rice and 25% more than maize, with the result that cassava is the cheapest source of calories for both human nutrition and animal feeding. A recent study on cassava shows that it accounts for about 70% of the total calories intake of more than half of the population (Nneoyi and Henry, 2008). A major limitation of cassava production is the rapid post-harvest deterioration of its roots which usually prevents their storage in the fresh state for more than a few days (Okezia and Kosikowski, 2004). Fresh cassava roots show deterioration within as little as 24 hours. Apart from rapid post-harvest spoilage, another problem associated with cassava is that the cassava roots contain toxic component known as cyanogens (Ogunsua, 1989). Thus, the roots should be subjected to some form of processing usually involving treatment by heat or fermentation before consumption in order to remove the toxic principles. Processing of cassava into various values added products through development of appropriate technologies have potential to increase income and improve livelihood of cassava growers. Many technologies are available on the processing of cassava elsewhere in the world (Arihantana, 1987; Damardjati, 1993; Nestel, 1976; Okezia, 1982). However, these are not suitable for direct adoption in Bangladesh due to socio-economic and cultural limitation. In Bangladesh, biscuits are now gaining popularity and are no more limited in usage to higher income groups of the population only. Biscuits are more amenable to variation in the formulation to meet a wide spectrum of consumer demands with respect to taste and nutritional requirement.
Keeping the above points in mind the present investigation has been under taken with the following objectives: a) to develop sweet biscuit using suitable formulation of cassava flour and wheat flour. b) To standardize the methods for production of good quality cassava flour fortified biscuits. c) To study the shelf life of the formulated biscuits. d) To study the overall acceptability of the formulated biscuits.
MATERIALS AND METHODS
The study was conducted in the laboratories of the Department of Food Technology and Rural Industries, Bangladesh Agricultural University, Mymensingh. The fresh tender cassava roots collected from Modhupur were used in the study. Cassava roots (figure 1) were washed in clean water to remove adhering soil, dirt and stone and other unwanted materials. The cleaned roots were then peeled with knife and cut into slices of about 2.0 mm thickness. The slices were than blanched at 900 C for about 6-7 minute in boiling water to inactivate the enzyme system. The blanched pieces of cassava were dried in the cabinet drier on stainless steel trays with a tray load of 1.25 lb/ft2 and the temperature and drying time were 650C for 8 hours. After cooling to room temperature, the dried pieces were ground in flour mill to produce cassava flour (figure 2). The cassava flour is then packed in a polyethylene bags for further use. Teer brand commercial wheat flour (12-13% moisture and 8-9% protein) was used for this experiment. Sugar, milk powder, baking powder, ammonium bicarbonate, salt and other ingredients were procured from the local market. High-density polyethylene was used for package and storage of samples.
The basic formulation used for preparation of cassava biscuits are outlined in table 1. The basic formulation of biscuits has been adapted from the recipes reported by Hoseney (1986) and Kent (1984).
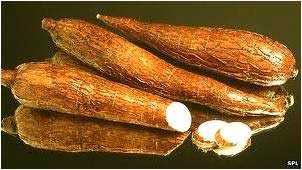
Figure 1
Cassava roots
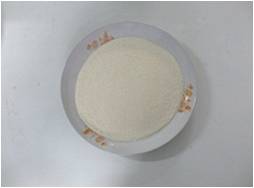
Figure 2
Cassava flour
Table 1
The basic formulation of cassava flour fortified biscuits
| Ingredients | Samples | |||||
| S1 (Control) | S2 | S3 | S4 | S5 | S6 | |
| Wheat flour (g) | 100.0 | 92.0 | 84.0 | 76.0 | 68.0 | 60.0 |
| Cassava flour (g) | _ | 8.0 | 16.0 | 24.0 | 32.0 | 40.0 |
| Sugar (g) | 60.0 | 60.0 | 60.0 | 60.0 | 60.0 | 60.0 |
| Hydrogenated Dalda (g) | 20.0 | 20.0 | 20.0 | 20.0 | 20.0 | 20.0 |
| Milk powder (g) | 5.0 | 5.0 | 5.0 | 5.0 | 5.0 | 5.0 |
| Bicarbonate (g) | 0.50 | 0.50 | 0.50 | 0.50 | 0.50 | 0.50 |
| Salt(g) | 1.0 | 1.0 | 1.0 | 1.0 | 1.0 | 1.0 |
| Egg(g) | 40.0 | 40.0 | 40.0 | 40.0 | 40.0 | 40.0 |
| Vanilla (drops ) | 2 | 2 | 2 | 2 | 2 | 2 |
Wheat flour was replaced with cassava flour at 8%, 16%, 24%, 32% and 40% substitution level by weight in samples S2, S3, S4, S5, S6 respectively. Sample S1 was control that contains no cassava flour. According to table 1 all ingredients were weighed accurately and mixed thoroughly to make adequate dough and allowed to rest for a while then the dough was rolled to a uniform thickness of 3 mm. The sheet was cut according to the desired shape and size of biscuits with a cutter of 4 cm diameter and baked oven at 210°C for 8 min. Cooled to ambient temperature and packed in plastic bags. The spread ratio of biscuits was initially used as an important parameter of biscuit quality. The spread ratio was determined by the formula W/T, where W is the average diameter (cm) of the six biscuits and T is the average thickness (cm). Processed cassava biscuit samples were chemically analyzed for moisture content, protein, ash, fat, starch and sugar and carbohydrate (AOAC, 2005 and Singh, 2002). Total carbohydrate contents of samples were calculated by difference, that is the percentage of moisture, protein, fat and ash was subtracted from 100 (Pearson, 1976). [Total carbohydrate=100- (moisture +protein +fat +ash); Total unavailable carbohydrate= 100- (moisture + protein +fat +ash +sugar +starch)].
Sensory evaluation of prepared biscuits (Hedonic rating test)
The sensory evaluation of six types of biscuits containing various proportions of cassava flour was evaluated for color, flavor, texture and overall acceptability by a panel of 15 tasters. The panelists were selected from the teachers, students and employees of Bangladesh Agricultural University, Mymensingh and were briefed before evaluating sensory quality of the biscuits. For statistical analysis of sensory data, a 9-point hedonic rating test (Singh (2002) was performed to assess the degree of acceptability of cassava biscuits containing different percentage of cassava flour. The taste panelists were asked to rate the sample on a 9-point hedonic scale for color, flavor, texture and overall acceptability with the ratings of : 9 = like extremely, 8= like very much, 7 = like moderately, 6 = like slightly, 5= neither like nor dislike, 4= dislike slightly, 3= dislike moderately, 2= dislike very much, 1= dislike extremely. The results were evaluated by analysis of variance and Duncan’s New Multiple Range Test (DMRT) procedures of the MSTAT system.
Storage studies of prepared biscuits
The cassava fortified protein biscuits along with control sample was stored at ambient temperatures (27°C to 35°C) for a period of 6 months. The stored biscuits were analyzed initially at an interval of 15 days up to four month, then at an interval of 20 days for the rest period. During storage studies the change in moisture content, peroxide and fatty acid value, texture and flavor were observed according to the methods described in AOAC (2005).
RESULTS AND DISCUSSION
Proximate composition of raw cassava, cassava flour and wheat flour
Raw cassava, cassava flour and wheat flour were analyzed for moisture, protein, fat, ash, total sugar and total carbohydrate content. The results are shown in table 2. Protein content of raw cassava was lower (0.90%) than that of cassava flour (6.70%). But the protein content of wheat flour was higher than cassava flour. On the other hand carbohydrate content of cassava flour was higher (80.79%) than that of wheat flour (74.33%). So we can expect more energy from cassava flour. Similarly mineral content of cassava flour was higher than that of wheat flour.
Table 2
Composition of raw cassava, cassava flour and wheat floor
| Components | Raw cassava | Cassava flour | Wheat floor |
| Moisture (%) | 66.00 | 10.00 | 13.20 |
| Protein (%) | 0.90 | 6.70 | 11.07 |
| Fat (%) | 0.50 | 0.85 | 0.90 |
| Ash (%) | 0.70 | 1.66 | 0.5 |
| Total carbohydrate | 31.90 | 80.79 | 74.33 |
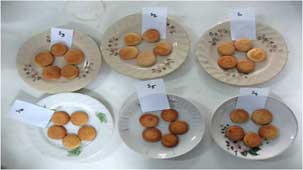
Figure 3
Appearance of biscuits of different formulation
Table 3
The effect of cassava flour on weight, width, thickness, spread ratio and moisture content of biscuits
| Biscuit type | Level of cassava flour (%) | Weight of biscuit (g) | Width of biscuit W (cm) | Thickness of biscuits T (cm) | Spread ratio W/T | Moisture content (db)% |
| S1 | 0 | 4.95 | 4.70 | 0.64 | 7.35 | 5.32 |
| S2 | 8 | 5.00 | 4.42 | 0.63 | 7.02 | 5.15 |
| S3 | 16 | 5.05 | 4.43 | 0.62 | 7.15 | 5.00 |
| S4 | 24 | 5.02 | 4.35 | 0.62 | 7.02 | 4.60 |
| S5 | 32 | 4.96 | 4.30 | 0.61 | 7.03 | 4.50 |
| S6 | 40 | 4.99 | 4.28 | 0.63 | 6.79 | 4.05 |
S1= Control biscuit (without cassava), S2=8% cassava biscuit, S3=16% cassava biscuit, S4=24% cassava biscuit, S5=32% cassava biscuit, S6=40% cassava biscuit
Table 4
Chemical composition of the prepared biscuits
| Sample | Moisture% | Protein% | Fat% | Ash% | TotalSugar | Starch% | TotalCarbohydrate |
| S1 | 5.32 | 9.00 | 10.00 | 1.50 | 17.00 | 22.00 | 74.18 |
| S2S2 | 5.15 | 7.10 | 10.1 | 1.80 | 19.00 | 28.50 | 75.85 |
| S3 | 5.00 | 6.95 | 10.15 | 1.90 | 22.50 | 30.95 | 76.00 |
| S4 | 4.60 | 6.65 | 10.30 | 1.95 | 24.00 | 32.10 | 76.50 |
| S5 | 4.50 | 6.60 | 10.32 | 2.00 | 25.60 | 34.50 | 76.58 |
| S6 | 4.05 | 6.10 | 10.35 | 2.50 | 27.00 | 36.00 | 77.00 |
S1= Control biscuit (without cassava), S2=8% cassava biscuit, S3=16% cassava biscuit, S4=24% cassava biscuit, S5=32% cassava biscuit, S6=40% cassava biscuit
The effect of cassava flour on the physical properties of biscuits
The physical properties of biscuits were evaluated and the results are presented in table 3. The weight of the cassava flour containing biscuit samples were higher than that of control biscuit (table 3).The biscuit containing 16% cassava flour was the higher in weight compared to other samples (figure 3). The width of the control biscuit was higher than those of the cassava flour incorporated biscuit. Among the cassava flour containing biscuit the sample S3 (16% cassava) gave the higher width than others (figure 3). Control biscuit gave the highest thickness. The spread ratio is concerned as one of the most important quality parameters of biscuits since it correlates well with texture, grain fineness, bite and overall mouth feel of the biscuit. It can be seen from table 3 that the addition of cassava flour significantly influences the spread ratio of biscuits. The spread ratio of biscuits with 16% cassava flour was higher than other combinations of cassava flours (figure 3).
Chemical composition of cassava flour fortified biscuits
The biscuit samples were analyzed for moisture, protein, fat, ash, total sugar, starch, total carbohydrates and a summary of chemical composition of the biscuits are shown in table 4.
Table 5
Mean score for flavor, color, texture and overall acceptability of formulated biscuits
| Sample code* | Sensory Attributes | |||
| Color | Flavor | Texture | Overall acceptability | |
| S1 | 7.47a | 7.94a | 7.07a | 7.20a |
| S2 | 6.07b | 6.94b | 5.94b | 6.54b |
| S3 | 5.80b | 6.94b | 5.80b | 5.74c |
| S4 | 5.74b | 6.87b | 5.80b | 6.00bc |
| S5 | 5.94b | 6.74b | 5.47b | 5.87c |
| S6 | 5.94b | 6.47b | 5.27b | 5.67c |
| LSD | 0.4825 | 0.5067 | 0.6345 | 0.5376 |
Means with same superscript within a column are not significance different at p<0.01
*wheat flour was replaced with cassava flour at 8%,16%,24%,32% and 40% substitution level by weight in samples S2, S3, S4, S5, S6 respectively. Sample S1 was control containing no cassava flour
The data in table 4 showed that the moisture content of control biscuits S1 was higher than those of cassava flour biscuits. This might be due to the fact that cassava flour contained higher amount of solid matters compared to wheat flour. Foda (1984) reported moisture content in biscuit in the range of 2.24- 6.97% which is almost similar with the present study.
In present study it was observed that the protein content of cassava flour biscuit (table 4) was lower than that of control biscuit. Assume that low protein cassava fortified biscuits may be processed with addition of cassava flour at different levels. Foda (1984) reported protein content in the biscuits in the range of 11.43-17.14% which is in agreement with the protein content of the biscuits reported in this study.
Fat content was highest 10.35% in samples S6 where wheat flour was substituted by 40% cassava flour and lowest in sample S1, 10.00% which was controlled sample. The increased values in fat content were observed with the increase in percentage of cassava flour in the biscuit samples.
The ash content of different processed biscuit samples presented in table 4 ranged from 1.5 – 2.50%. The maximum ash was found in sample S6 (40% cassava flour) and lowest in sample S1, (control sample). Increased addition of cassava flour in different sample increased the ash content of biscuit. Because cassava flour contained higher amount of solid matters compared to wheat flour. (Kabirullah et al. (1996) found ash content in biscuits in the range of 1.09-2.78% which is in agreement with the results observed in this study.
The total sugar content of different processed biscuit samples ranged from 17.00 to 27.00% in this study is higher than the results observed by Kabirullah et al. (1996). It may be stated that the total sugar content in the processed biscuits were higher than the range of commercial biscuits available in the market.
Table 6
Storage studies of prepared biscuit products
| Storage period (days) | Sample Code | Observations | |||||||
| Moisture content (%) | Peroxide value (%) | Free fatty acid value (%) | Texture | Flavor | Remarks | ||||
| weight basis | Dry basis | ||||||||
| 0 | S1 | 5.32 | 5.61 | 27.53 | 0.97 | Crisp | Good | Good | |
| S2 | 5.15 | 5.42 | |||||||
| S3 | 5.00 | 5.26 | |||||||
| S4 | 4.60 | 4.82 | |||||||
| S5 | 4.50 | 4.71 | |||||||
| S6 | 4.05 | 4.22 | |||||||
| 15 | S1 | 5.57 | 5.89 | 27.53 | 0.97 | Crisp | Good | Good | |
| S2 | 5.38 | 5.69 | |||||||
| S3 | 5.04 | 5.31 | |||||||
| S4 | 4.68 | 4.91 | |||||||
| S5 | 4.58 | 4.80 | |||||||
| S6_ | 4.08 | 4.26 | |||||||
| 30 | S1 | 5.60 | 6.00 | 27.57 | 0.97 | Crisp | Good | Good | |
| S2 | 5.52 | 5.85 | |||||||
| S3 | 5.08 | 5.36 | |||||||
| S4 | 4.77 | 5.01 | |||||||
| S5 | 4.62 | 4.85 | |||||||
| S6 | 4.15 | 4.34 | |||||||
| 45 | S1 | 5.75 | 6.11 | 27.58 | 0.99 | Crisp | Good | Good | |
| S2 | 5.62 | 5.96 | |||||||
| S3 | 5.23 | 5.52 | |||||||
| S4 | 4.85 | 5.10 | |||||||
| S5 S5 | 4.66 | 4.89 | |||||||
| S6 | 4.19 | 4.38 | |||||||
| 60 | S1 | 5.90 | 6.28 | 27.60 | 0.99 | Crisp | Good | Good | |
| S2 | 5.76 | 6.12 | |||||||
| S3 | 5.37 | 5.68 | |||||||
| S4 | 4.98 | 5.25 | |||||||
| S5 | 4.70 | 4.94 | |||||||
| S6 | 4.31 | 4.51 | |||||||
| 75 | S1 | 6.00 | 6.39 | 27.61 | 1.01 | Crisp | Good | Good | |
| 90 | S1 | 6.15 | 6.56 | 27.62 | 1.06 | Crisp | Good | Good | |
| S2 | 5.96 | 6.34 | |||||||
| S3 | 5.60 | 5.94 | |||||||
| S4 | 5.15 | 5.44 | |||||||
| S5 | 4.87 | 5.13 | |||||||
| S6 | 4.50 | 4.72 | |||||||
| 105 | S1 | 6.25 | 6.67 | 27.64 | 1.11 | Crisp | Good | Good | |
| S2 | 6.10 | 6.50 | |||||||
| S3 | 5.69 | 6.04 | |||||||
| S4 | 5.24 | 5.54 | |||||||
| S5 | 4.96 | 5.22 | |||||||
| S6_ | 4.58 | 4.81 | |||||||
| 120 | S1 | 6.34 | 6.78 | 27.71 | 1.23 | Crisp | Good | Good | |
| S2 | 6.20 | 6.61 | |||||||
| S3 | 5.79 | 6.15 | |||||||
| S4 | 5.29 | 5.59 | |||||||
| S5 | 5.08 | 5.36 | |||||||
| S6 | 4.69 | 4.93 | |||||||
| 140 | S1 | 6.49 | 6.95 | 27.75 | 1.24 | Crisp | Good | Good | |
| S2 | 6.34 | 6.77 | |||||||
| S3 | 5.97 | 6.36 | |||||||
| S4 | 5.46 | 5.78 | |||||||
| S5 S5 | 5.25 | 5.55 | |||||||
| S6 | 4.85 | 5.10 | |||||||
| 160 | S1 | 6.62 | 7.12 | 27.80 | 1.26 | LessCrisp | SlightlyRancid | FreshnessDeclined | |
| S2 | 6.53 | 6.99 | |||||||
| S3 | 6.20 | 6.62 | |||||||
| S4 | 5.67 | 6.02 | |||||||
| S5 | 5.47 | 5.79 | |||||||
| S6 | 4.97 | 5.23 | |||||||
| 180 | S1 | 6.79 | 7.29 | 27.90 | 1.29 | Damp | Rancid | NotAcceptable | |
The total carbohydrate content of different samples in this study is in accordance with the study observed by Kabirullah et al. (1996). The total carbohydrate content of cassava flour biscuit was higher than that of cassava flour free (control sample) biscuit. The variations in the carbohydrate contents among biscuit samples may result from the difference in the level of protein, fat, ash and moisture content.
Sensory evaluation of prepared biscuits (Hedonic rating test)
The prepared biscuits were evaluated by 15 tasters. The mean scores for color, flavor, texture and overall acceptability preference of the biscuits are represented in table 5. One-way analysis of variance indicated that all these sensory attributes of different biscuits were significantly (P<0.01) different and thus the sensory attributes of the biscuit samples showed varied degrees of acceptability (table 5).
The biscuits samples S1, (control) were the most preferred one and significantly better for color than those with cassava flour containing biscuits. The color score of biscuits were in the decreasing order as: control biscuits (Sl) >8% cassava flour biscuit (S2) >16% cassava flour biscuit (S3)>24% cassava flour biscuit (S4). But samples S5 to S6 are equally acceptable.
The score for flavor of the control biscuit (S1) was the highest and was significantly different from the biscuit containing 8% cassava flour (S2). The flavor of biscuits samples containing 8 to 40% cassava were equally acceptable but the biscuits containing 40% cassava flour (S6) had the least flavor acceptability.
Texture of the control biscuit (S1) was most the preferred and significantly different than those with cassava biscuits. Texture score of biscuits were in the decreasing order as: control biscuits (S1) >8% cassava flour biscuit (S2) >16% cassava flour biscuit (S3). But 24% cassava flour biscuit (S4) scored same as 16% cassava flour biscuit (S3).On the other hand,32% cassava flour biscuit (S5)>40% cassava flour biscuit (S6) or in other words, as substitution level of cassava flour increased, the score for overall acceptability decreased.
Table 5 shown that there was significant (P<0.01) difference in overall acceptability among the biscuits. This indicates that the overall acceptability of control biscuits (S1) and biscuits supplemented with cassava flour samples are not equally acceptable. However, the overall acceptability score of biscuits were in the decreasing order as: control biscuits (S1) >8% cassava flour biscuit (S2) >24% cassava flour biscuit (S4) >32%, cassava flour biscuit (S5) > 16%, cassava flour biscuit (S3)>40% cassava flour biscuit (S6).
Storage studies of prepared biscuit products
The biscuits packed in low density polythene. The shelf-life of the processed biscuits was studied for a period of 6 months at ambient conditions (27 to 35°C). No remarkable changes were observed up to 4 months of storage in case of moisture content, peroxide value, fatty acid value, texture and flavor. During storage of samples it was noticed that moisture content, peroxide value and fatty acid value were increasing slowly. So all the samples were become less crisp and taste changing to rancid. After passing time these defaults become higher. So the study provide conclusion in case of storage of biscuit fortified with cassava flour were shelf-stable up to 4 months of storage at ambient conditions table 6.
From the experiment it was shown that when using higher amount of cassava flour, the physical characteristics of the biscuits remain good. Observing the moisture, protein, fat and ash contents, results of the shelf-life of the processed biscuits, it may be concluded that good quality cassava flour fortified biscuits may be processed substituting the wheat flour by cassava flour up to 24% levels. The formulation may be improved by addition of food colors, flavors and vitamins.
REFERENCES
AOAC (2005). Official Methods of Analysis. 15th edition.Association of Official Analytical Chemists. Washington, DC.
Arihantana MB (1987). Detoxification and stability of Indonesian cassava products, PhD thesis, School of Biological Technologies, Department of Food science and Technology, University of New South Wales, Sydney, Australia.
Damardjati DS, Widowati S and Rachim A (1993). Cassava flour production and consumers acceptance at village level in Indonesia. Indonesia agricultural Research and Development Journal, 15(1): 16-25.
FAO (2011). FAO production Year Book. Food and Agricultural Organization of the united Nations, Food Policy and Nutrition Division, Rome.
Foda YH, Allam MH, Mahmod RM and Elshatanovi GA (1984). Quality of biscuits supplemented with low fat soya flour. Annals of Agricultural Science, Egypt, 29 (1): 327-335.
Hoseney RC (1986). Principles of cereal science and Technology. American Association of cereal chemists. St. Paul, Minnessota.
Kabirullah M, Rukonuddin A, Khan SA, Tasmin A, Majibur RAKM, Islam KMA and Moazzem H (1996). Analysis of nutrients of Bangladeshi processed foods; Different types of biscuits. Bangladesh Journal of Scientific and Industrial Research, 31(3): 89-101.
Kent NL (1984). Technology of cereals: An Introduction for Students of Food Science and Agriculture, 3rd edition. Pergamon Press, Oxford.
Matthews RB and Hunt LA (2010). GUMCAS: A model describing the growth of cassava. Department of crop science, University of Guelph, Ontario NIG 2W1, Canada.
Nestel B and Cock J, (EDS) (1976). Cassava: The development of an international research network. Publisher: International Development Research Centre.
Nneoyi IO, Henry MN, Walter AM and Ebingha EE (2008). Group Dynamics and Technology use among female farmers in Akpabeyo local government area, Cropss River State, Nigeria Agricultural Journal, 3(4): 292-298.
Ogunsua AO (1989). Total cynide levels in bread made from wheat/cassava composite flours. International Journal of Food Science and Technology, 24 (4) 361-365.
Okezia BO, Kosikowski FV (2004). Cassava as food CRC. Critical Reviews in Food Science and Nutrition, 17:259-275.
Pearson D (1976). The Dictionary of Nutrition and Food Technology. Fifth edition. Butter Worth Publisher, London.
Shams-Ud- Din Md (2002). Training manual on cassava processing. Department of Food Technology & Rural industries, Bangladesh Agricultural University, Mymensingh. Sponsored by the REFPI Project of Department for International Development (DFID), UK.
Singh R (2002). Hand book of Analysis of quality control for fruit and vegetable products. Second edition, Tata Me Graw¬Hill pub. Co. Ltd. New Delhi.
Tonukari NJ (2004). Cassava and the future of starch. Electronic Journal of Biotechnology, 7(1).
![]()